
When the Evidence Challenges the Model
Building a System Willing to Challenge Itself
Building an analytical model is relatively easy compared with building a system willing to challenge its own conclusions.
A model can calculate a score. It can rank thousands of companies, generate forecasts, identify attractive securities, evaluate financial quality, and explain the reasoning behind its conclusions.
But there is a more difficult question: what happens after the prediction is made?
Did companies receiving higher Investment Scores actually perform better than companies receiving lower scores? Did the model identify securities that subsequently appreciated more frequently? Did its strongest selections outperform its weakest selections? And what should we do when the evidence does not initially behave the way we expected?
These questions led to one of the most important additions to AMAAS 2.0: the Evidence Loop.
What happened next was more interesting than simply proving the model correct. The evidence challenged us.
Closing the Loop
Traditional investment research has an accountability problem. An analyst publishes a price target. A strategist recommends a sector. A quantitative model identifies attractive securities. Months later, assumptions have changed and the original prediction can become difficult to reconstruct.
AMAAS 2.0 was designed differently. Each research cycle creates an immutable historical snapshot containing the information available to the system at that moment. Investment Score, market price, forecasts, supporting metrics, and evidence are preserved. Subsequent market prices are collected independently.
Prediction → Freeze → Observe → Measure → Learn
The final step matters. Learning does not necessarily mean changing the model. Sometimes it means discovering that we were asking the wrong question about the model.
The Original Accountability Question
The first implementation grouped companies into absolute Investment Score ranges such as 80–89, 70–79, 60–69, 50–59, and Below 50. The original intuition seemed reasonable: if Investment Score contains useful information, higher-scoring groups should outperform lower-scoring groups.
Initially, we concentrated heavily on median return. Median is resistant to extreme observations and describes what happened near the center of the population.
But the AMAAS thesis was never primarily about predicting the return of the middle security. It was about portfolio selection.
The Portfolio Matters
Earlier AMAAS portfolios frequently displayed a recognizable pattern: a small number of very large winners, several moderate winners, and a few losers. In an equal-weighted portfolio, the exceptional winners matter. They are not statistical nuisances. They are part of the economic result.
This led to the first major Evidence Loop lesson:
The statistic used to evaluate a model should correspond to the economic hypothesis the model is intended to test.
For an equal-weighted selection strategy, arithmetic average return has an important interpretation: it approximates the return of allocating equal capital across the securities being evaluated.
We therefore recalculated the accountability results using arithmetic average return. Immediately, the average exposed something the median had largely hidden.
When the Average Became Too Informative
Some securities showed extraordinary one-day returns—more than 50%, 100%, 300%, 500%, and in one case several thousand percent.
Closer examination revealed very-low-priced securities and instruments such as warrants and rights. A move from $0.0002 to $0.0112 is mathematically an enormous percentage return even though the absolute price movement is barely more than one cent.
This did not make the return mathematically wrong. It revealed a population-comparison problem.
A Percentage Can Be Correct Without Being Statistically Comparable
A security moving from $0.10 to $0.124 has gained 24%. A security moving from $100 to $124 has also gained 24%. If equal amounts of capital could be invested under identical liquidity and execution conditions, the economic return is the same.
The statistical problem is different. Very-low-priced securities can belong to a substantially different return distribution. Tiny absolute changes, large bid-ask spreads, illiquidity, security structure, corporate actions, and distressed conditions can create extreme percentage observations.
When thousands of securities are aggregated using an arithmetic mean, a small number of these observations can exert disproportionate statistical weight.
Why a Lower Price Limit Matters
Earlier versions of the Equity Selection Engine used minimum-price requirements as part of defining an investable universe. The Evidence Loop demonstrated why such a rule has a second purpose: it can reduce noise and the disproportionate statistical weight of extreme percentage movements associated with very-low-priced securities.
The purpose is not to make unfavorable evidence disappear. A security whose price increases 500% should remain recorded as a 500% observation. Its history should remain auditable. Its return should not be capped, rewritten, or silently discarded.
Instead, accountability should distinguish the primary investable population from a separately visible low-priced, high-volatility diagnostic population.
This answers two different questions:
What actually happened to every security?
What does the evidence tell us about the ranking behavior of the investable population for which AMAAS was designed?
A minimum lower limit therefore reduces statistical noise without changing the underlying evidence. The threshold itself should be selected for investability and population-comparability reasons—not selected after the fact because a particular value produces a more favorable result.
Testing the Threshold Instead of Assuming It
Rather than immediately choosing a cutoff, we examined accountability results with no minimum price and with minimum baseline prices of $5, $10, $20, $35, and $50.
As progressively lower-priced securities were removed, the most extreme arithmetic-return distortions diminished. But the expected monotonic relationship between Investment Score and one-day average return still did not appear.
That was uncomfortable evidence—and exactly the kind of evidence the system was created to preserve.
Changing the scoring model at that point would have contaminated the experiment. So we did not change it.
From Score Bands to Relative Ranking
Investment Score is fundamentally a ranking mechanism. Whether an absolute score of 72 is inherently “good” is less important than whether a company scoring 72 ranks above most of the eligible universe.
That suggested a cleaner experiment: rank the population itself and divide it into deciles.
D1 represents the highest-ranked 10%. D10 represents the lowest-ranked 10%. This allowed us to ask whether subsequent behavior changed as we moved from the companies AMAAS ranked most favorably toward those it ranked least favorably.
The first one-day decile experiment did not show a strong monotonic relationship between score and average return. But another pattern emerged: the frequency of positive outcomes generally deteriorated as ranking declined.
Accountability 2.0
The decile experiment led to a more intuitive executive framework. AMAAS Accountability 2.0 divides each frozen research universe into three populations:
| Population | Interpretation |
|---|---|
| Top 30% | Highest-ranked 30% of the frozen research universe. |
| Middle 40% | Middle-ranked comparison population. |
| Bottom 30% | Lowest-ranked 30% of the frozen research universe. |
Each population is evaluated using three independent measures: Average Realized Return, Median Realized Return, and Positive Outcome Rate. Observation count remains visible as well.
Rather than substituting whichever statistic happens to support AMAAS most favorably, Accountability 2.0 reports them together.
The First Accountability 2.0 Evidence
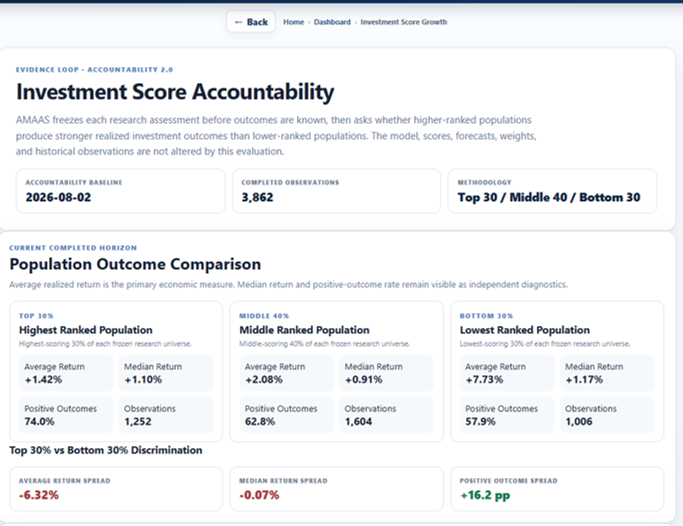
The first completed horizon contained 3,862 one-day observations. The results were:
| Population | N | Average | Median | Positive Outcomes |
|---|---|---|---|---|
| Top 30% | 1,252 | +1.42% | +1.10% | 74.0% |
| Middle 40% | 1,604 | +2.08% | +0.91% | 62.8% |
| Bottom 30% | 1,006 | +7.73% | +1.17% | 57.9% |
The breadth result was encouraging. Approximately three out of four observations in the Top 30% were positive, compared with fewer than three out of five in the Bottom 30%. That produced a positive-outcome spread of roughly 16 percentage points.
But average return told the opposite story. The Bottom 30% appeared to outperform dramatically.
Had we displayed only positive outcomes, AMAAS would have looked impressive. Had we displayed only average return, it would have looked poor. The Evidence Loop must show both.
The D10 Clue
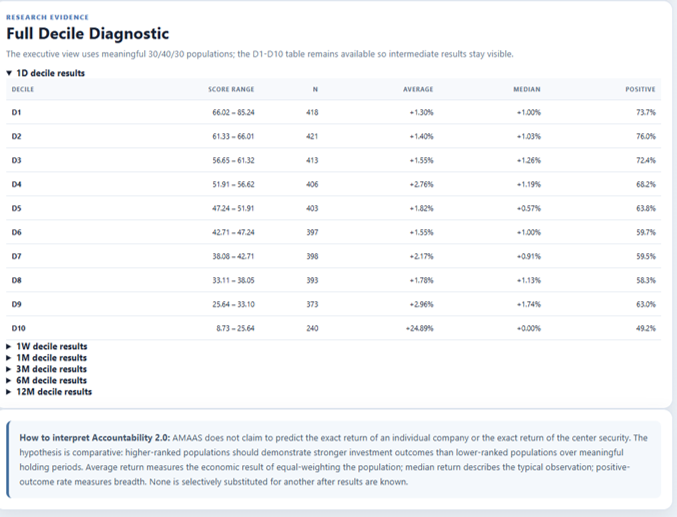
The full decile diagnostic helped explain the contradiction.
The lowest-ranked decile reported an average one-day return of approximately +24.89%, a median of 0.00%, and a positive-outcome rate of only 49.2%.
Those three numbers cannot be interpreted as broad 25% appreciation across the population. Half of the observations were approximately at or below zero, while a relatively small number of extreme positive returns pulled the arithmetic mean sharply upward.
This is exactly why average, median, breadth, price-level eligibility, and the underlying distribution must be interpreted together.
Why We Did Not Change Investment Score
Perhaps the most important decision during this process was something we did not do.
We did not change Investment Score. We did not change its weights. We did not rewrite the August predictions. We did not modify historical market prices or remove inconvenient outcomes.
The predictions remained frozen.
What changed was our understanding of how those predictions should be evaluated.
Average, Median, and Breadth Answer Different Questions
Average return asks what happened economically to an equal-weighted collection of securities.
Median return asks what happened to the typical observation and helps reveal whether the arithmetic mean is being dominated by the tails of the distribution.
Positive Outcome Rate asks how frequently the population generated a positive result.
None of these measures should be selectively substituted for another after results are known.
Ranking Discrimination May Matter More Than Point Prediction
An Investment Score of 75 does not mean that AMAAS knows precisely what a security will return. A more defensible interpretation is that the company exhibits characteristics that rank more favorably than much of the eligible universe based on information available at that time.
Accountability therefore becomes a discrimination problem:
Do populations ranked more favorably by AMAAS subsequently demonstrate better investment characteristics than populations ranked less favorably?
Those characteristics may include higher average return, better median outcomes, greater frequency of positive outcomes, lower downside frequency, stronger risk-adjusted performance, or combinations that become meaningful only at longer horizons.
One Day Is Not an Investment Horizon
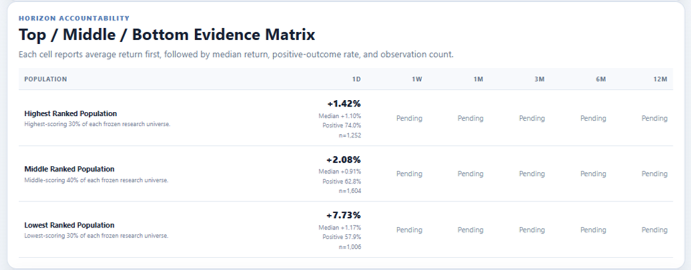
Only the one-day accountability horizon had matured when this chapter was written. The 1-week, 1-month, 3-month, 6-month, and 12-month observations remained pending.
AMAAS was not designed primarily as a next-day trading model. Its valuation, expected-return, financial-quality, solvency, probabilistic forecasting, sentiment, and macroeconomic components describe evidence whose significance may require time to emerge.
A one-day test can expose data-quality issues, distributional anomalies, and preliminary ranking behavior. It cannot yet answer the most important long-horizon question.
Accountability Is Part of the Model
Before building the Evidence Loop, it was tempting to think of accountability as something that happens after analytical work is complete. That view has changed.
A system that produces predictions without preserving them cannot reliably learn from them. A system that preserves predictions without collecting subsequent evidence has memory without accountability. A system that collects outcomes but changes the experiment whenever results become uncomfortable risks confirmation bias.
The architecture therefore requires immutable historical predictions, independent subsequent observations, transparent evaluation methodology, and a record of methodological changes.
The Evidence Loop Should Be Allowed to Disagree With Us
If every experiment inevitably confirms a model, the experiment provides little information.
The first AMAAS accountability results did not provide the clean relationship we expected. That was useful. They exposed limitations in absolute score bands, median-only analysis, arithmetic averages dominated by extreme observations, and the mixing of materially different security populations.
None of these lessons required rewriting the original prediction. They required listening to the evidence.
From Prediction Engine to Learning System
The original Equity Selection Engine asked: Which companies look most attractive today?
AMAAS 2.0 adds: What happened after we said that?
The Evidence Loop adds a third question: What can we learn from the difference between what we expected and what actually happened?
That third question changes the nature of the platform. Every completed research cycle becomes a historical experiment. Every subsequent observation becomes evidence. Every matured horizon increases the sample.
The Experiment Continues
The first Evidence Loop results are not the conclusion. They are the beginning.
At the one-day horizon, higher-ranked populations demonstrated substantially greater breadth of positive outcomes than lower-ranked populations. The evidence does not yet demonstrate that higher Investment Scores produce monotonically higher average returns. Both facts belong in the record.
The next evidence will arrive automatically:
One week.
One month.
Three months.
Six months.
Twelve months.
The predictions have already been made. They are frozen. The market will determine the outcomes. AMAAS will record them.
A model capable of remembering its predictions, confronting its outcomes, and learning from the difference is no longer simply producing analysis.
It is beginning to accumulate experience.
For informational and educational purposes only. AMAAS research, scores, forecasts, accountability measurements, and portfolio observations are analytical tools and do not constitute personalized investment advice, a recommendation to buy or sell any security, or a guarantee of future performance.